
Financial market mechanics explained in 6 minutes
Every day, billions of transactions are executed in several stock exchanges. These transactions are regulated and available to the world to analyse. But to interpret this market data, one must understand how the markets work. This is what I’ll explain in 6 minutes.
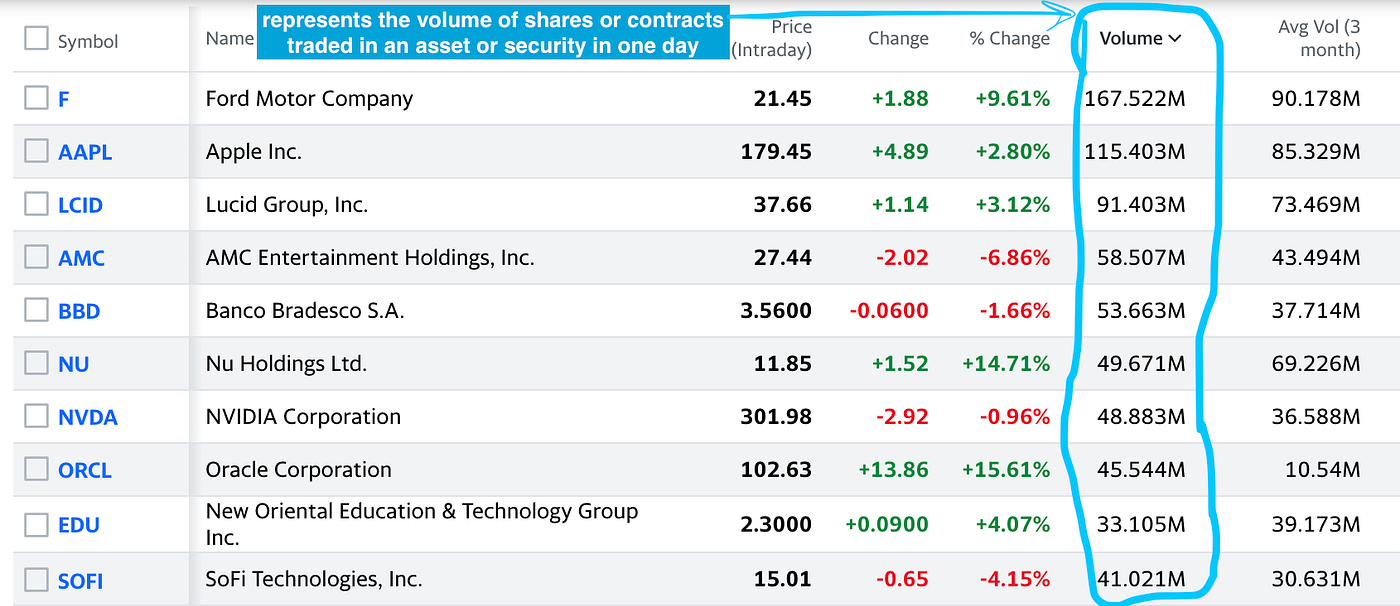
Most active trading stocks by volume today (12/12/2021) [1]
[1/9]. Buyer vs Seller
Financial markets work with two laws: The law of demand and the law of supply.
“The law of demand says that at higher prices, buyers will demand less of an economic good.
The law of supply says that at higher prices, sellers will supply more of an economic good.
These two laws interact to determine the actual market prices and volume of goods that are traded on a market.” [2]
These two concepts can be observed on order books: a document that shows buy orders vs sell orders. Each order consists of a price and a volume.
[2/9]. Order book
When a company enters the market to sell its shares, the company stock price is determined using metrics such as revenue, number of employees, and many others.
After the stock price has been set, people start trading the stock, which affects the stock price value accordingly. How much it will go up or down is not a function of some company metric anymore, but a function of demand and supply (i.e. how many times was a stock sold or bought, and for how much).
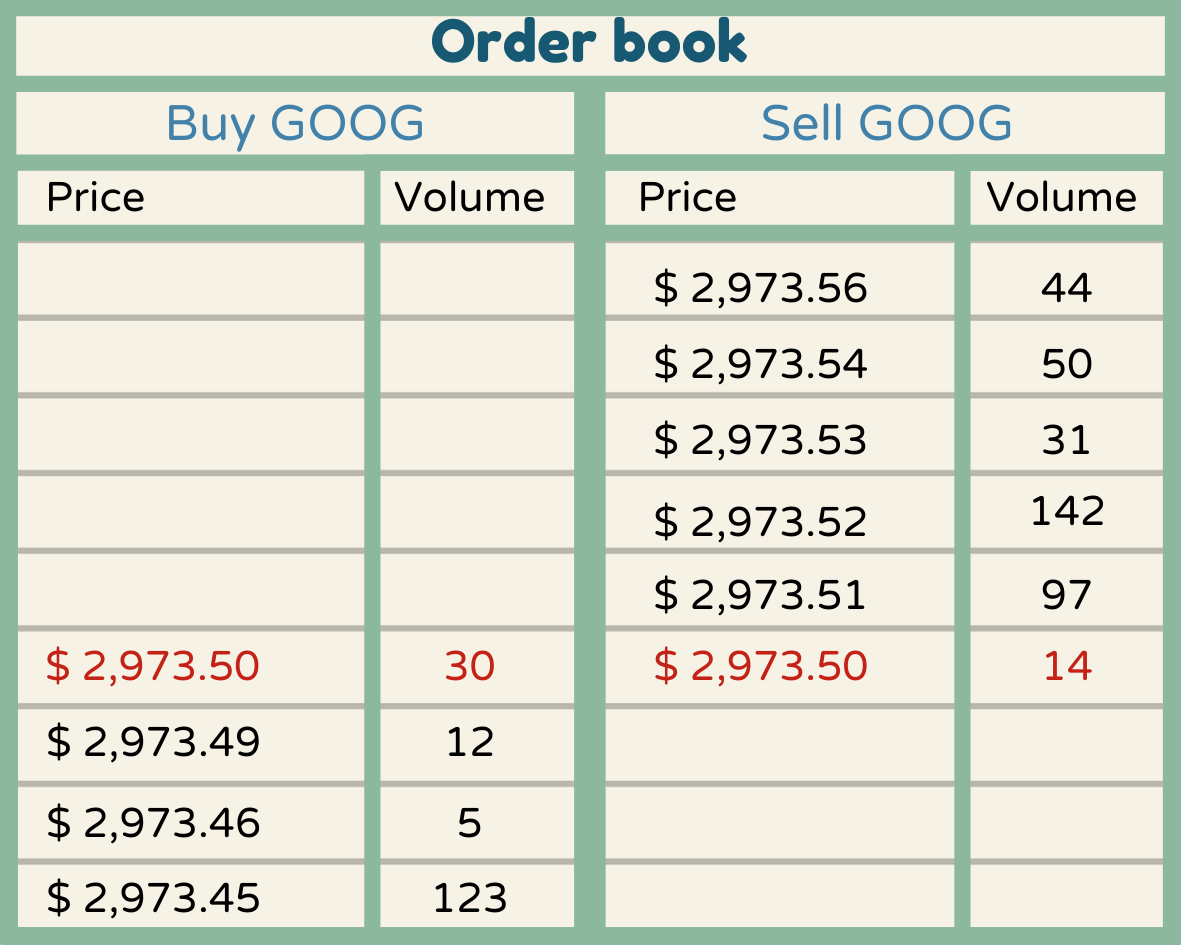
Order book for Alphabet Inc. (arbitrary values used for learning purposes only)
When one buys a stock, it queues in the order book.
Question: If we wanted to buy 30 Alphabet stocks (GOOG) for $ 2,973.50, would we be able to do so according to the above order book?
Answer_: Partially. Why do you ask? Well…_There’s a buyer (us), on the left side of the order book, that is willing to buy 30 stocks for $ 2,973.50.
There’s a seller on the right side that is selling 14 stocks for the price we asked (i.e. $ 2,973.50).
Hence we can only buy 14 stocks out of 30 at $ 2,973.50 at that specific time.
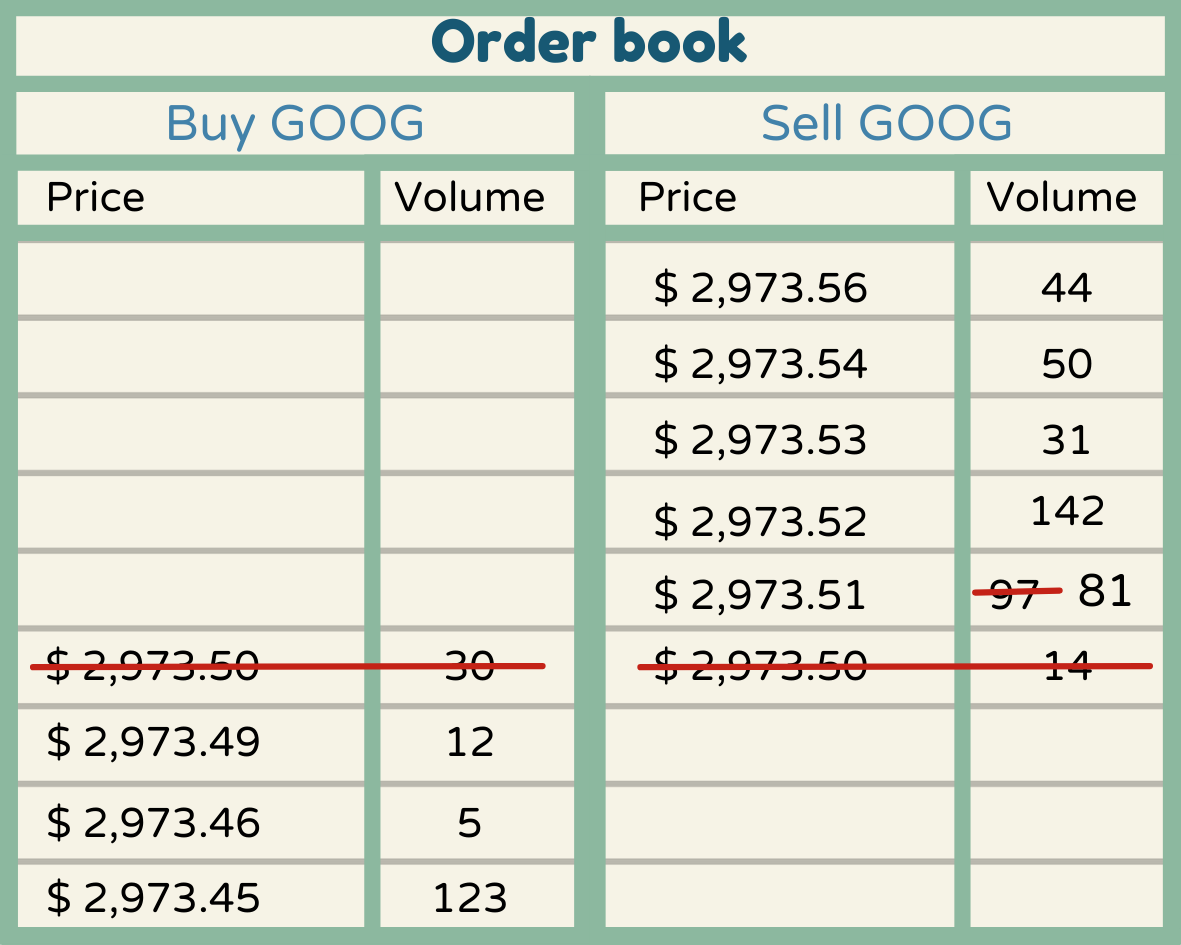
Alternative: To buy more stocks, we decided to increase our buy price by $ 0.1. Now we can buy the remaining 16 stocks because there are 97 stocks available at $ 2,973.51.
[3/9]. Track real prices
Order books are nice, but what if you wanted to track the evolution of stocks with time? Then it becomes way easier to plot these prices in graphs.
Question: Which price from the order book should we use to plot realistic graphs?
Answer: Lowest sell price? Highest buy price?
None of the above! Instead, we plot the latest traded stock price.
Here’s how it looks:
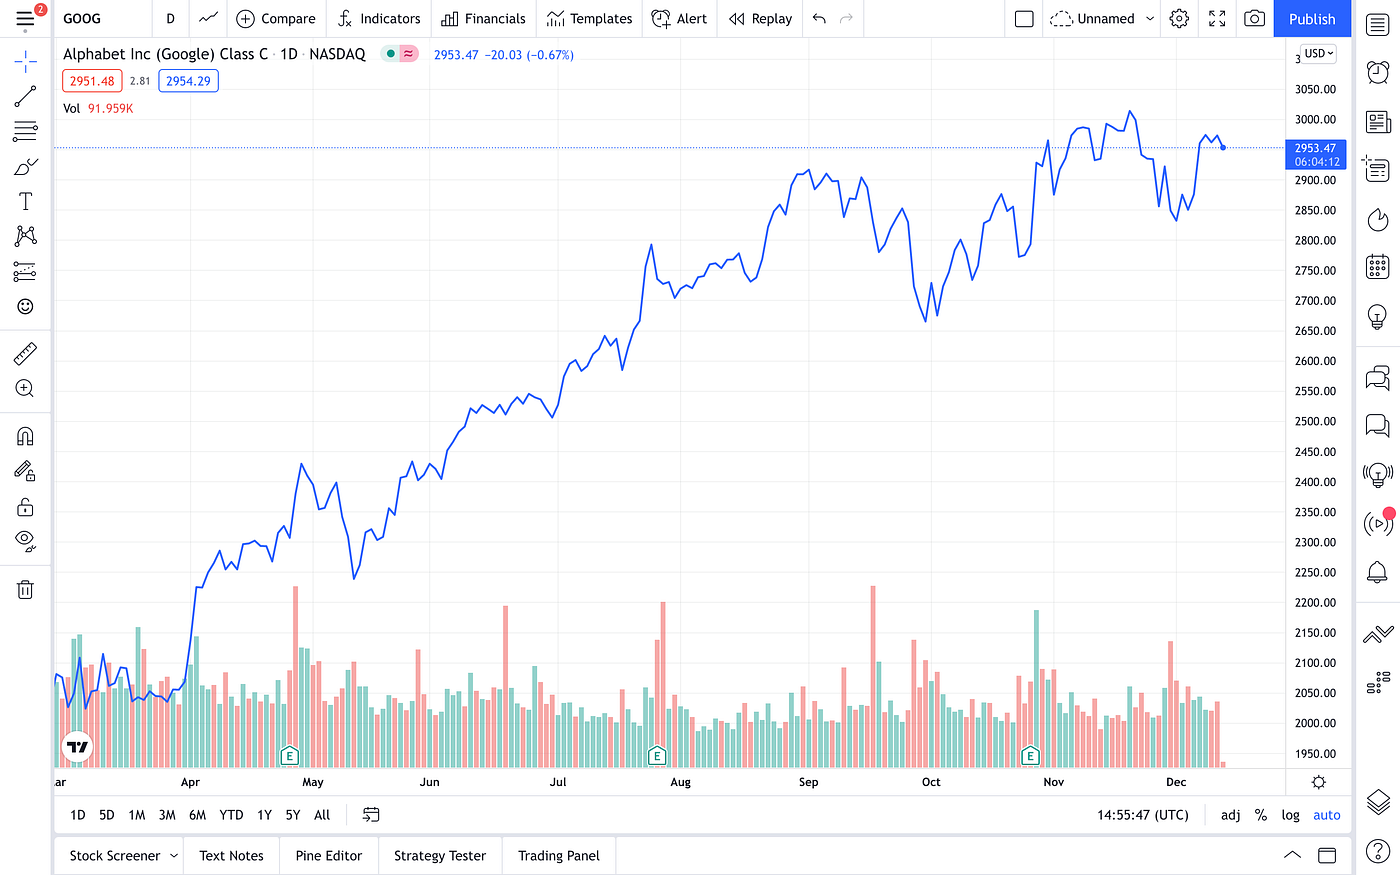
NB: The blue curve is the stock price evolution with time. The red/green histogram corresponds to the stock volume at a given time.
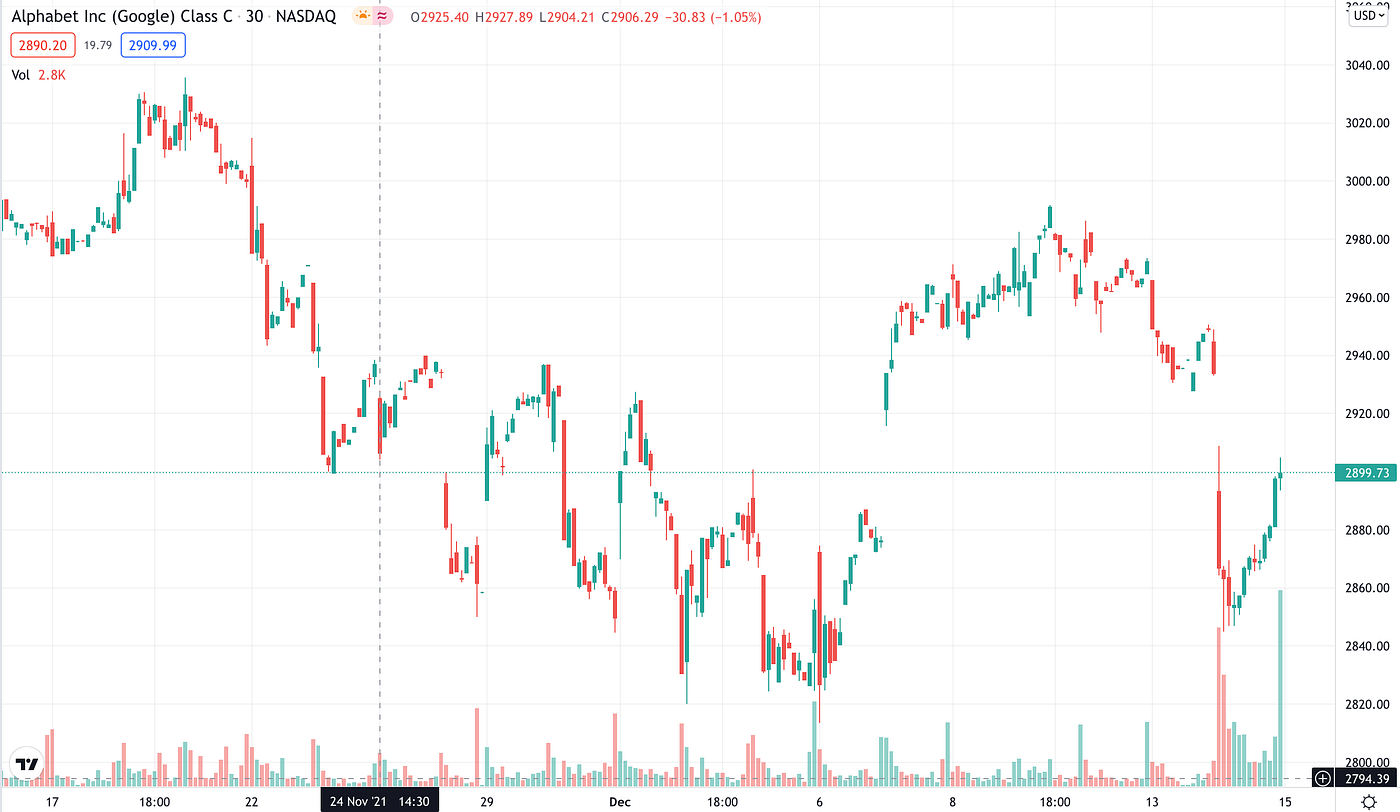
[4/9]. OHLC
OHLC stands for ‘Open High Low Close’. It is another famous way to read market data graphs using timestamps.
The above rectangles are called candles. One must read them accordingly to the stock price momentum (whether it’s going up or down).
Here’s how it looks on a graph that traders see every day:
And here’s how it works if we (theoretically) zoom in one candle:
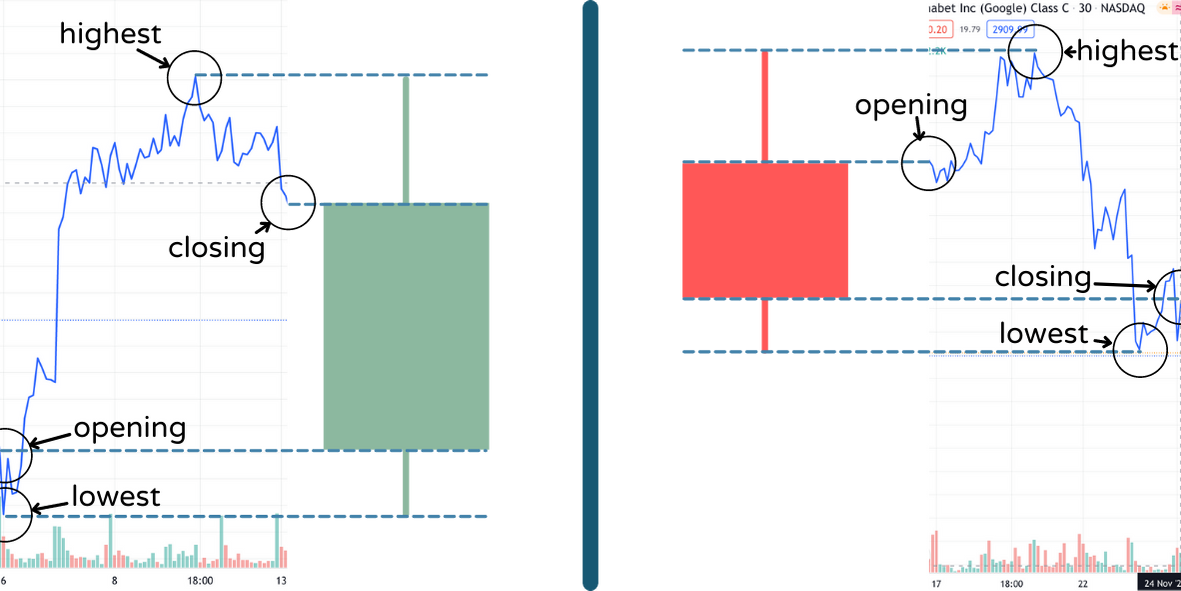
Green -> stock price increasing; Red -> stock price decreasing
With one candle, one can have an insight on volatility, opening/closing prices, momentum and range of a price in a given period of time.
[5/9]. Major actors in markets
The authority that enables buyers and sellers to get the best deals at the right volume is called a stock exchange.
If you can easily buy securities without thinking of finding a seller, it is because there are market makers that sell and buy a lot of securities (millions of times per day), to make sure that markets are liquid* (i.e. meaning that there are a lot of buyers, a lot of sellers, and that the price difference between buying and selling a security is not too high).
Consequently, market makers play the role of buyers when you want to sell a security, and the role of seller when you’re the buyer.
*(Paragraph 6 gives more info on liquidity. )
5.1. Sell-Side
Market makers are also called the sell-side. However, the sell-side actors vary depending on the market (i.e. Foreign Exchange, Stocks, Bonds, etc). In general, sell-side refers to organisations that provide products and services for the… you guessed it… buy-side.[3]
5.2. Buy-Side
Individual investors or firms that purchase financial securities are referred to as the buy-side.
[6/9]. Liquidity
Market-makers ensure high market liquidity. In other words, they’re the ones who ensure that anyone can buy and sell securities at high volumes instantly, at any time, without sharp security price changes. This makes prices relatively predictable, inducing low risks investments.
[7/9]. Arbitrage
It is possible to buy and sell securities from different markets. What’s more, this security could have different prices on different markets. Making a profit out of these differences of the same security on several markets is called arbitrage, and is a popular trading method that allows adjustments in price between securities of different markets worldwide.
[8/9]. Timezones
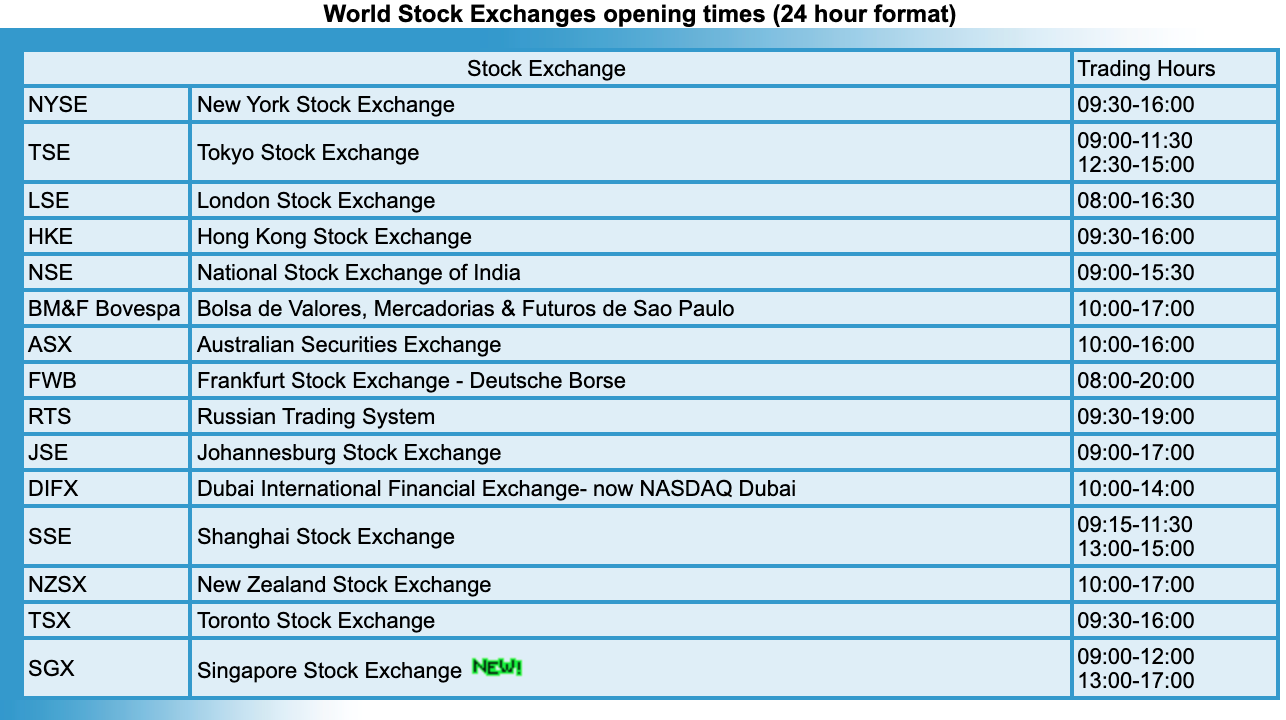
World Stock Exchange opening times (24 hours format - local times - holidays excluded) [4]
Stock exchanges are physical places located in different countries with different timezones. It means that one can trade for 24 hours 5 days a week, excluding bank holidays, if needed. These differences in timezones give traders time to think about timezones.
But why do markets close in the first place? Not because of traders and exchange operators mental health, come on… that would be too easy. With the rise of automated trading systems, the reaction to market fluctuations is almost instantaneous (we’re talking about nanosecond-scale responses) and could lead to flash-crashes. Having opening and closing times gives time to market regulators to mitigate various risks, and particularly risks due to automated trading. Note that some exchanges allow pre-market and post-market sessions respectively between 4:00 am to 9:30 am and 4:00 pm to 8:00 pm.
[9/9]. Gaps in Market Data
Sometimes, you can find gaps or discontinuities in market data due to bank holidays, when the market is threatened due to events causing high volatility or cyber-security reasons. Gaps can also show in a single security market data if, for instance, a company is experiencing major internal events (legal issues, ownership major changes, etc) or is bankrupt.
The aim of this article is to understand the big picture of market mechanics. Of course, markets are more complex than what I just explained, but at least now you know what you don’t know! Congrats! That’s a huge improvement.
If you follow my articles, you will be able to create a trading bot using momentum trading from scratch. I make sure to keep articles under 10 mins reading time, always using simple terms and clear illustrations.
Liked what you read? I try to understand quantitative finance and explain my findings intelligibly.
Feel free to like, comment and share if you like what I do. It means a lot to me 😁
References
[1] Yahoo Finance, “finance.yahoo.com,” constantly updated. [Online]. Available: https://finance.yahoo.com/most-active/. [Accessed 12 Dec 2021].
[2] J. Fernando, “Investopedia.com,” 07 Nov 2021. [Online]. Available: https://www.investopedia.com/terms/l/law-of-supply-demand.asp. [Accessed 8 Dec 2021].
[3] J. Chen, “investopedia.com,” 31 Mar 2021. [Online]. Available: https://www.investopedia.com/terms/s/sellside.asp. [Accessed 9 Dec 2021].
[4] worldtimezone.com, “worldtimezone.com,” 2021. [Online]. Available: https://www.worldtimezone.com/markets24.php. [Accessed 20 Dec 2021].
To write this article, I also used my notes from the Udacity Nanodegree “Artificial Intelligence for trading” and the course ‘Forex Pro Trader Program’ by youngtraderwealth, which I highly recommend.